LEAF
- Tim Morton, CFA

- Aug 11
- 2 min read
Morton Investment Research has created a strategy to replicate the positive performance of the S&P 500 with less volatility. The underlying investments have been purchased to track the strategy's performance. Ongoing reports will review performance, volatility risk and capital risk.
Leveraged ETF Allocation Formula. Phase 1. Proof of Concept
Why LEAF? – Seeking Superior Risk Adjusted Returns Through Defensive Investing
Investment Objectives:
To generate returns greater than the S&P500 over a 2-5 year period through superior downside capture.
To experience lower drawdowns during periods where the S&P 500 corrects by greater than 20%
Investment Philosophy:
Predicting the short to medium term direction of the underlying components of the strategy is difficult and not required for success
The performance drag that accompanies portfolio diversifiers can be overcome through leverage.
Attempting to fully participate in equity upside while protecting against outsized losses leads to significant long term outperformance due to the nature of compounding. (33% loss needs a 50% gain to break even, 50% needs 100% etc)
Applying leverage to a hedged portfolio seeking to outperform the S&P 500, without increasing drawdowns, is possible through the holding of "risk off" ETFs, if correlations between the ETF holdings stay within their historical range over time
“Risk mitigation should raise your returns" – Mark Spitznagel, Universa Investments
Risk parity strategy
50% of targeted volatility comes from the S&P500 and 50% comes from 4 defensive ETFs

Portfolio Construction

2.44x exposure as of November 22, 2021. Total exposure has historically varied between 2.30x and 2.53x, depending on trailing volatility levels of the 5 ETFs
Starting April 17, 2008 (time frame is limited by the availability of natural gas futures price history).When leveraged ETF price history was not available, we simulated historical performance based off 1x indexes and ETFs.
All ETFs/stocks are purchased in USD but priced back to CAD for an additional hedge(purchasers of the strategy would be recognizing returns in CAD)
Positions are rebalanced at a predetermined deviation from their target weight. Historically, this has been every 17.3 trading days on average.
Index Statistics


Log Performance Chart

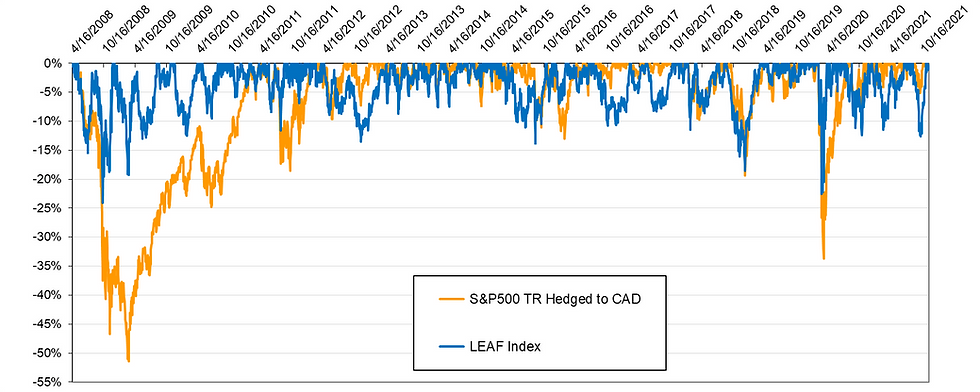
Drawdowns
Rolling 6 Month Returns

regards, Tim
Tim Morton, CFA is a retired portfolio manager with 45 years of experience working with private clients. For the past two years, the editor of mortonir.com and a contributor to Barron's. My comments are not to be taken as investment recommendations. They are purely for discussion purposes. Please see your advisor for investment advice.


Comments