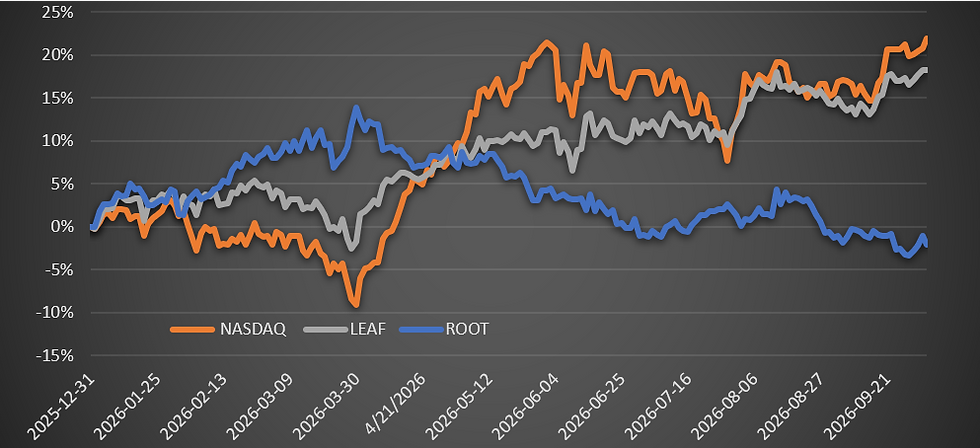
LEAF: Improving Returns, Drawdown Protection, and Efficiency

I have been reviewing several potential improvements to the LEAF allocation framework. The goal is not simply to increase returns, but to improve the strategy’s efficiency: how much return it generates, how much capital it requires, and how well it behaves when Nasdaq exposure is under pressure.
I noticed the LEAF model is doing something counterintuitive. On normal down days, LEAF moves with the market, with a 41% downside capture versus QQQ. But during larger Nasdaq drawdowns, the model has historically provided positive offsetting performance, with -34% drawdown capture.
That distinction matters.
Down capture tells us how the strategy behaves on all negative market days, including many small and ordinary pullbacks. Drawdown capture focuses on the periods that matter most: the larger Nasdaq selloffs where investors actually need protection.

The chart above shows LEAF’s drawdown performance going back to 2007. The blue points represent LEAF’s performance during Nasdaq drawdown periods, while the orange line shows the Nasdaq Total Return Index hedged to CAD.
The key takeaway: LEAF has often made money during the larger Nasdaq drawdowns, even though it still participates modestly in normal day-to-day market weakness.
Three Potential Enhancements
I am currently evaluating three adjustments to the model.
1. Replace Simplify Managed Futures Strategy ETF (CTA) with Unlimited Managed Futures ETF (HFMF)
The first change is switching our Managed Futures exposure from CTA to HFMF.
HFMF targets approximately 2x the volatility of the managed futures index, making it more capital efficient. That matters because capital efficiency is central to the LEAF framework. If a defensive or diversifying sleeve requires less capital to achieve a similar risk contribution, more capital can be allocated to the core return engine.
The tradeoff is liquidity.
At the time of analysis, HFMF had less than $30 million in AUM, and its bid/ask spread was typically around 20 bps, compared with approximately 6 bps for CTA. That does not make HFMF unusable, but it does mean position sizing, trading frequency, and implementation costs need to be monitored carefully.
2. Remove TAIL and Eventually BTAL
The second change is to remove TAIL and, eventually, BTAL.
Both are relatively low-volatility products, which means they consume a meaningful amount of capital when targeting risk parity. In a capital-efficient framework, that is a problem.
The timing matters, though. Low beta is currently very oversold, so I would not rush the BTAL change immediately. The model improvement is clear in the backtest, but implementation should still respect the current market setup.
The broader point is that low-volatility defensive products may look attractive in isolation, but they can be inefficient inside a constrained allocation model. If they require too much capital for too little risk contribution, they may reduce the overall effectiveness of the strategy. Jim Paulson pointed this out in, “Risk Aversion Gone Missing,” Paulsen Perspectives, Substack, July 2, 2026.

3. Improve the Rebalancing Logic
The third change is enhanced rebalancing.
I found that short replication is most effective on TQQQ, but less profitable on inverse VIX and managed futures exposure. Those other assets appear to be more momentum-driven, while TQQQ is more responsive to mean-reversion signals.
The adjustment is straightforward:
Increase the sensitivity to short replication for TQQQ, where mean reversion has been most effective.
Reduce the sensitivity for SVXY and HFMF, where the signal appears less effective.
The result is important: the model keeps overall trading activity roughly the same, while improving returns and reducing risk.
Why Drawdown Capture Matters
One of the challenges in optimizing a strategy like LEAF is deciding how to measure risk.
Common measures all have drawbacks.
Sharpe ratio is useful, but it penalizes upside volatility. For a strategy designed to participate in strong upside moves, that can be misleading.
Worst drawdown is also useful, but it is based on a single historical moment that may not repeat. It can overemphasize one unusual event while ignoring the broader pattern of how the strategy behaves across many drawdowns.
Down capture includes too many ordinary down days. A small negative day in QQQ is not the same as a sustained market drawdown where investors need protection.
That is why I think drawdown capture is especially useful for LEAF.
The question is not simply, “How does LEAF perform when QQQ is down today?”
The better question is:
How does LEAF perform when QQQ is in a meaningful drawdown?
That is where the current model has been strongest. The base LEAF model has a 41% down capture, but a -34% drawdown capture. In other words, LEAF may decline modestly during ordinary negative Nasdaq days, but during larger drawdown periods it has historically tended to make money.
That is exactly the kind of behavior the strategy is designed to produce.
Backtest Results
The table below compares the current LEAF base model against the proposed changes.

The enhanced rebalancing version produces the strongest overall profile.
Returns rise from 20.2% to 28.6%, while drawdown capture improves from -34.1% to -45.9%. The Sharpe ratio improves from 1.37 to 1.53, and the return-to-average-worst-drawdown ratio improves from 2.33 to 2.61.
The tradeoff is that the strategy becomes more volatile overall. Volatility increases from 14.8% to 18.7%, and the average of the 10 worst drawdowns deteriorates from -8.7% to -11.0%.
So this is not simply a “free” improvement. The enhanced model takes more risk, but it appears to take that risk more efficiently.
TThe result is a model with higher returns, better drawdown capture, a stronger Sharpe ratio, and improved return relative to major drawdown risk.
The main tradeoff is higher overall volatility. That is worth monitoring, but the improvement in drawdown capture is encouraging. LEAF is not just trying to outperform QQQ. It is trying to behave differently when QQQ is under stress.
That is where the strategy continues to look most interesting.
This research is for informational purposes only and does not constitute investment advice. Backtested results are hypothetical and do not guarantee future performance. ETF characteristics, liquidity, spreads, and AUM can change over time and should be verified before implementation.